|
|||||||
|
|||||||
|
|||||||


|
|||||||
|
|||||||
|
|||||||
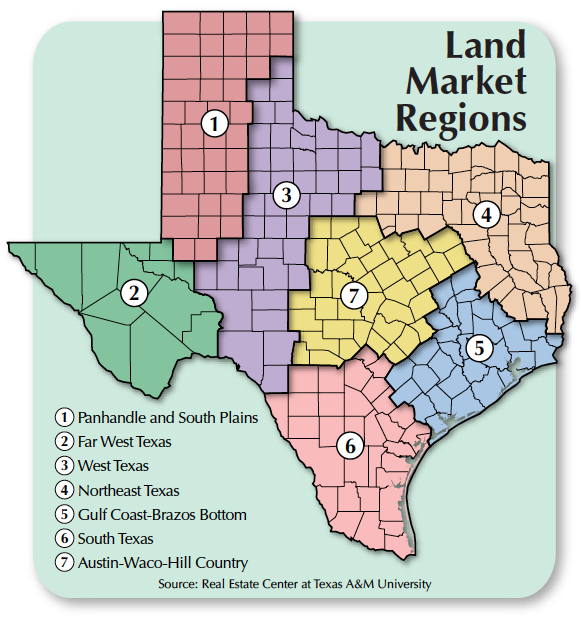
Texas’ size and vast landscapes make insightful discussions on statewide market trends difficult. Unlike, say, Iowa, where rural land is relatively contiguous in terms of geography and production types, Texas’ rural land is dedicated to many different production types and influenced by numerous nonagricultural factors. As a result, the Real Estate Center conducts its rural land research at a regional level. Studies done at the regional level avoid “washing out” important details and trends that can occur when aggregating at the state level. The regional studies also capture factors tied not only to agricultural production and rural land management but also off-land trends specific to those areas.
In 2002, the Real Estate Center attempted to capture the unique characteristics of Texas land markets by delineating rural land market regions. Countywide assessment of land types and production as well as input from regional land experts determined the seven regions used today. Seventeen years later, the Center can assess the success of the original delineation.
Dividing an area into distinct regions proves difficult because one could reasonably argue for making regions bigger or smaller. For instance, areas on a region’s periphery tend to look similar to the surrounding regions, so why not make that region larger? On the other hand, the differences within a region promote the argument of splitting regions even further. Several measures can be used to determine the success of the regions’ delineations.
First, are the regions different enough to justify the boundaries created? A pairwise test performed on the relationships between each of Texas’ seven regions addressed the question of uniqueness. The tests assessed the ability of one region’s price history to explain or predict changes in another region’s prices. Results indicate limited predictive power from one region to another for all possible regional relationships. Most results indicated each region largely explained itself, and including price information from other regions did not improve the predictive nature of the model. These results show historical data from other regions is not statistically relevant and, therefore, the markets are statistically different from each other.
Next, do the regions make sense intuitively to regional land market experts? Most importantly, regional delineation must make intuitive sense to market participants. Several information sources were considered in determining the regions. The Center used historical land market data, including rural land uses and production, and consulted land market experts to create a holistic view of the markets that researchers, due to limited resources, would not fully obtain by using only one source or the other.
Finally, do the regions provide enough data individually to make statements about the regional markets? The database used to make generalizations about regional land trends consists of land sales taking place within each region at a particular point in time. As the number of transactions in the database increases, so does the strength of the generalizations made. Having more transactions also reduces the chance of an obscure transaction skewing a region’s general trends.
The Center’s database has an average of over 2,000 market transactions per region per year (see figure). Some regions average more than 3,000. Only in Region 2 (Far West Texas) do market transactions average fewer than 100 per year. While Region 2’s average is far fewer than other regions, the number of acres per transaction is considerably higher. Given the nature of Region 2 land, the number of transactions is typical for that market.

Texas land market regions, while similar in many regards, vary in production and land use. Production diversity is a product of the varied geography and soil types across the state. Pasture remains the predominant land-use type. Other uses range from timber to cropland. The regions capture these inherent differences to create coherent submarkets.
Region 1 (Panhandle and South Plains) is responsible for 48 percent of Texas’ cropland production, the highest concentration in the state. The region also accounts for 66 percent of Texas’ irrigated cropland. While upland cotton and winter wheat are the predominant crops, the region accounts for about two-thirds of the total acreage in Texas dedicated to corn production.
By contrast, Region 2 (Far West Texas) holds about 3 percent of the state’s cropland production. Unlike many other regions, its geography is not suitable for most types of crops, but the region does account for about 20 percent of Texas orchards. Native pasture dominates the rural landscape at 96 percent of rural land use.
Regions 3, 6, and 7 (West Texas, South Texas, and Austin-Waco-Hill Country, respectively) contain about 80 percent of the state’s wildlife management land with Region 3 accounting for about 21 percent. Region 3 is largely native pasture with about 17 percent dedicated to cropland production, predominantly winter wheat and upland cotton. Because about 95 percent of the cropland is dryland production, these less water-intensive crops dominate Region 3.
Region 6, with about 29 percent of the state’s wildlife management acreage, differentiates itself from Regions 3 and 7 by having more acreage dedicated to orchards and sorghum production. It contains about a third of the state’s orchards and grows 42 percent of the state’s sorghum. San Antonio is in the region.
Close to 90 percent of Region 7’s land is used either as pasture or for wildlife management. The region has about a third of the state’s wildlife management land and about a quarter of the state’s orchard acreage, but 80 percent of the land is pasture, 69 percent of which is native pasture. Austin and the region’s scenic landscapes make the region popular for recreational land uses. Timber is grown mainly in Regions 4 and 5 (Northeast Texas and Gulf Coast-Brazos Bottom, respectively), with Region 4 accounting for roughly 83 percent of the state’s timber production. Region 5, meanwhile, is 71 percent pasture and is responsible for 100 percent of the state’s rice production, 66 percent of peanut production, and 63 percent of oat production. Both regions have major metropolitan areas (Dallas in Region 4 and Houston in Region 5), which tend to affect local rural land markets.
When regions are established successfully, transaction characteristics such as price per acre and average acreage sold tend to be consistent. While these characteristics don’t align completely, patterns should arise indicating unique markets exist.
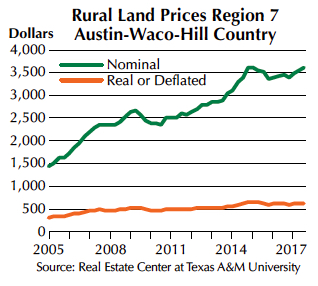
For example, as noted, native pasture dominates both Regions 2 and 7, but the transaction characteristics in each region differ substantially. Because of its location and lower land productivity, Region 2 (Far West Texas) generally yields smaller prices per acre and larger tracts per purchase. Land sales for Region 7 (Austin-Waco-Hill Country), however, tend to have smaller acreage sales with larger per-acre prices because the area is optimal for recreational use because of its proximity to metropolitan areas. Last year, the number of acres per sale averaged 6,923 in Region 2 and 218 in Region 7. Similarly, Region 2 land on average sells at a lower price than Region 7 land. Last year, Region 2 land averaged $791 per acre while Region 7 averaged $3,466. The differences in land use and proximity to potential buyers shape the land’s dollar and acre profiles.
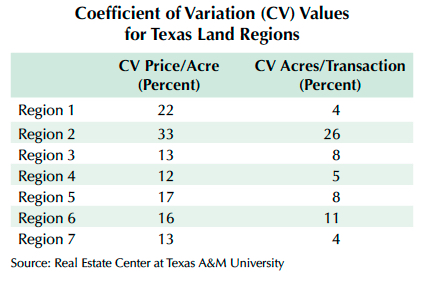
Another way to gauge the consistency of a region’s sales transactions is by looking at the coefficient of variation (CV), which is the standard deviation of the data divided by the mean. The coefficient of variation measures the average variability of a data series relative to its mean. The table shows each region’s CV for both prices paid and number of acres sold in a transaction. Region 2 has the largest CV with 33 percent variation around the mean for price per acre and 26 percent variability in the acres sold per transaction. In other regions, such as Region 4, there is as little as 12 percent variability around the price-per-acre mean and 5 percent variability around the mean acreage sold.
Texas’ rural land submarkets are a result of the state’s size and geographical diversity. According to several measures, the seven land market regions defined by the Center have successfully captured the inherent qualities of each submarket, ensuring greater accuracy in reporting of Texas land market trends.
Dr. Kiella (ehardin@mays.tamu.edu) is an assistant research scientist with the Real Estate Center at Texas A&M University.
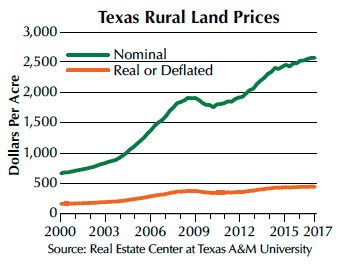
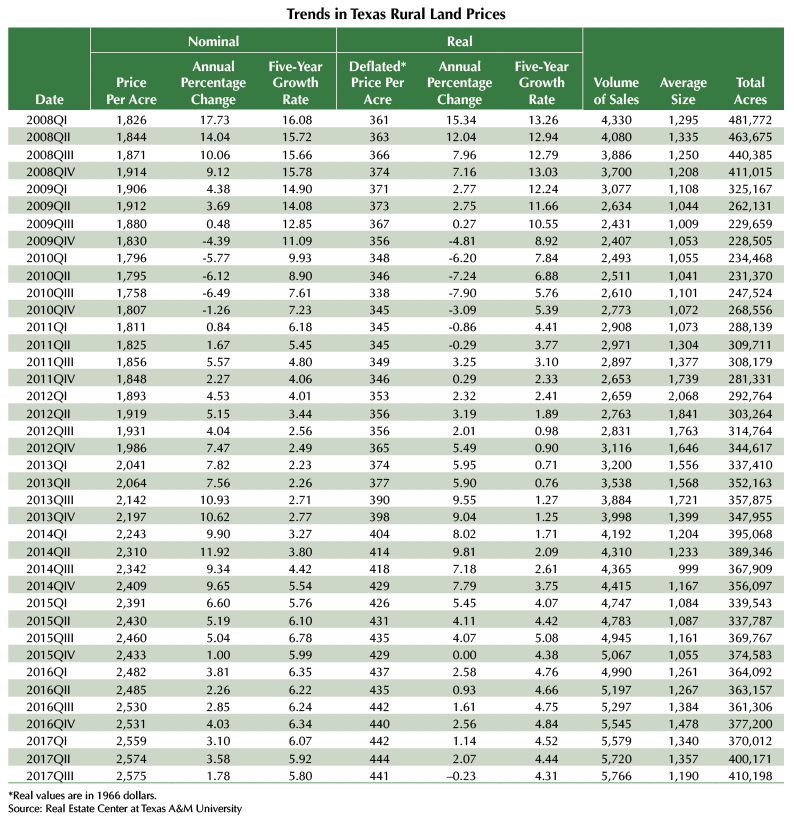
Overall, Texas land markets continued to grow on an annual basis. However, quarterly prices changed little since the first quarter. In addition, market conditions in various regions diverged, with three regions expanding and four showing emerging weakness.Texas land markets seemed headed for a breather in the third quarter after rebounding for the three preceding quarters. While the trend continued upward, the 1.78 percent statewide gain marked the lowest year-over-year price increase since fourth quarter 2015. The muted expansion confirmed much slower Texas rural land price appreciation compared with 2013–15 levels. The 5,766 transactions represented an active market compared with totals in past third quarters. The price settled at $2,575 per acre, well ahead of $2,530 per acre in third quarter 2016 and virtually matched the second quarter 2017 price of $2,574 per acre.


The second quarter market rebound in this region appears to have diminished in the third quarter as prices inched up 1.51 percent in year-over-year comparisons. At $1,140 per acre, the third quarter price fell short of the second quarter of $1,164 per acre. The 369 sales continued the robust pace, exceeding 2016 third quarter sales by 23 percent. Total acres expanded to the largest total since fourth quarter 2014. Dairy farmers’ purchases, which contributed to strength earlier in the year, appear to have waned.

The boom in oil exploration and production continued to drive prices in this region. Some buyers reportedly purchased ranches at high prices to gain access to sand for fracking wells in the drilling boom. Although slightly off second-quarter highs, overall prices continued to exceed those in 2016 by substantial margins. High bonus payments for mineral leases and purchases of land to secure water rights for municipalities put pressure on prices. The region continued to record a low level of activity, which limits the level of confidence in indicated prices.

Price growth in the West Texas region came to a halt in third quarter 2017, retreating 4.40 percent. The price decline coincided with an uptick in activity. The 599 sales exceeded the 566 sales a year earlier. This market gave up all of its 2017 gains, falling below 2016 second-quarter levels. The decline produced a price of $1,391 per acre compared with $1,481 in the first quarter.

Continued strong price growth in Northeast Texas boosted prices 6.59 percent above third quarter 2016. The 1,906 sales were 135 more than 2016. The $3,864 per-acre regional price reached an all-time high. Renewed interest in the Haynesville Shale and robust recreational demand gave this area the strongest performance in Texas.

Optimism born in the energy sector propped up markets in this region, reversing price declines with a 1.88 percent increase over third quarter 2016 despite Hurricane Harvey. At $5,679 per acre, sales in the region recovered to early 2016 levels. The sales volume of 674 dropped slightly from third quarter 2016 totals, perhaps reflecting a decline in the wake of Hurricane Harvey. Past flooding events suggest there will likely be a notable decline in activity for several quarters with little impact on prices. However, Harvey’s flooding reached unprecedented levels, so this market may face some turbulence.

Land markets in this area posted a solid 4.60 percent price increase during the third quarter, continuing a positive trend that began with fourth quarter 2016. Those increases ended four quarters of declines caused by turmoil in the energy industry. The $3,614 per-acre price coincided with a sizable expansion in activity at 561 sales, an increase of 124. Despite the gain in volume, observers suggest a dearth of properties for sale has contributed to strengthening prices.

The Central Texas market retreat slipped further into negative territory in the third quarter, falling 1.87 percent. This decline continues a five-quarter trend of increasingly smaller price changes. At $3,525 per acre, prices surrendered all of the gains posted in the first and second quarters. Sales volume expanded slightly with 1,637 sales compared with 1,519 in third quarter 2016.
Foreign buyers occasionally appear in rural land markets responding to changes in the economic environment. In the 1970s, a weak dollar unleashed a flood of foreign investors buying real estate, including agricultural land. That surge caused alarm in the economy’s agricultural sector, with critics decrying the surrender of control over productive U.S. land. Congress responded, adopting the Agricultural Foreign Investment Disclosure Act (AFIDA) in 1978. After an initial report by owners, rules implementing AFIDA further specified, “All foreign persons who acquire or transfer an interest in agricultural land thereafter are required to report such transactions within 90 days . . . ” (Foreign Holding of U.S. Agricultural Land Through December 31, 2014, Farm Service Agency [FSA] – U.S. Department of Agriculture).
Owners comply by filing a form FSA-153 with the Farm Service Agency, which provides that form on their websitehttps://forms.sc.egov.usda.gov/eForms/welcomeAction.do?Home.
Failure to comply can result in a “civil penalty of up to 25 percent of the fair market value of the interest held . . . .” This potentially serious consequence makes it imperative participants in land transactions involving foreign owners study the AFIDA requirements.
AFIDA mandates reports for agricultural land greater than ten acres in the aggregate. The definition includes land used for timber production, farming, and ranching within the past five years. Owners of interests in tracts of ten acres or less that produce more than $1,000 in sales of farm, ranch, or timber products must also file a report. Security interests such as mortgages and mineral interests do not require filing. AFIDA regulations also exempt leaseholds of less than ten years and certain other future interests. Otherwise, the owner must report “any interest” to FSA.
Foreign person as defined by AFIDA includes all individuals who are not citizens of the United States, the Northern Mariana Islands, the Trust Territory of the Pacific Islands, or those lawfully admitted for permanent residency in the U.S. Further, AFIDA considers entities created under the laws of foreign countries or with their principal place of business located there to be foreign owners. In addition, the act requires U.S. entities in which there is a significant foreign interest or substantial control by foreign persons to register.
Ownership of 10 percent of an entity by an individual or 50 percent by a group of individuals constitutes a significant interest or substantial control under AFIDA. Reports published by FSA provide more details on definitions and requirements. The reports are at https://www.fsa.usda.gov/programs-and-services/economic-and-policy-analysis/afida/index.
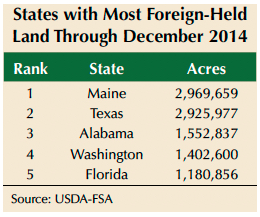
The FSA annual reports (2014 is the most recent) provide an account of the total acreage in foreign ownership as well as a breakdown of the types of land held. Reviewing those reports affords an insight into foreign activity in rural land markets nationally and down to the county level. The table lists the top five states for acreage held in foreign ownership with Maine ranking slightly ahead of Texas. Most of the Maine acreage consists of forests. Texas, Alabama, and Washington also support substantial expanses of forested acreage.
In fact, forestland composes the largest category of foreign-owned land nationwide (Figure 1). From 2006–08, major timber producers divested their land holdings, obviously transferring many acres into foreign ownership. After 2008, the three main categories of agricultural land in foreign ownership began to expand (forest, pasture, and cropland) with foreign holdings growing substantially through 2011. Cropland holdings continued to increase through 2014 while timber and pasture holdings remained steady.

The Texas experience somewhat mirrored national trends. The major departure from nationwide trends focuses on the forestland dynamics where foreign ownership exploded from 2006 through 2009, vaulting it from the smallest category to the largest, a place it maintained through the 2014 reporting cycle (Figure 2). Most of this expansion transpired in the pine timber region of East Texas and involved purchases by Canadian-owned entities.
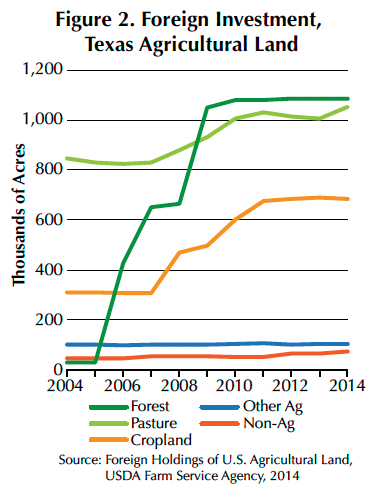
Pasture and cropland holdings grew substantially beginning in 2008 and continued that enlargement through 2011. From 2012 through 2014, holdings in all categories stabilized. Currently, anecdotal reports from the field suggest foreign purchasers from China may be fueling another increase in foreign ownership. FSA reports for 2015 (in preparation) and 2016 may confirm this trend.
The national distribution of foreign-owned acreage and the distribution in Texas by county are shown in Figures 3 and 4. Much of New England has little foreign ownership.

The largest acreage holdings occur in East, South, and West Texas (Figure 4). Tyler, Newton, Polk, and Hidalgo Counties have the largest acreage concentrations of foreign ownership along with the country of origin for the largest owners (Figure 5).


FSA reports identify the country of origin for the five nations with the largest land holdings by acreage and identifies those remaining as “Other.” The Other category comprises the foreign ownership in Briscoe, Culberson, Hidalgo, Jeff Davis, and Zavala Counties. Canadian owners dominate in five counties, all in the timberland region of East Texas. German owners prevail in Nolan, Sterling, and Willacy, perhaps focusing on cropland. The Netherlands appears in the forested areas of Polk and Trinity, but also in Presidio in West Texas. Ownership based in the United Kingdom focused on Reeves County.
The report documents a substantial expansion of parcels owned by foreigners, growing by nearly 40 percent from 2004 levels and 33 percent since 2007 (Figure 6). Texas should anticipate the potential for this statistic to expand as future markets see interest from foreign entities.

___
_________________
Dr. Gilliland (c-gilliland@tamu.edu) is a research economist with the Real Estate Center at Texas A&M University.
In the days since Hurricane Harvey hit, social media posts regarding insurance claims and the recently passed House Bill 1774 have spread like wildfire. Plaintiff’s lawyers paint it as an attempt to protect the powerful insurance companies, while insurance companies portray it as a deterrent to rampant insurance fraud. Either way, many are left wondering if and how they will be affected.
This is a summary of the law as it applies to most people in relation to Hurricane Harvey. It is not exhaustive, and it may apply differently to your particular situation. This is not legal advice and is not intended to be a substitute for the advice of your attorney.
Before we get to the bill itself, let me break the bad news. Most homeowners insurance policies do not cover floods. Damage from winds typically is covered, and some homeowners will also have separate windstorm coverage, but floods are not covered. If the roof is torn off or a window is broken, and water gets in that way, it’s probably covered. If rising or rushing flood waters caused the damage, it’s probably not, unless you have flood insurance.
Flood insurance typically is provided through the National Flood Insurance Program and then only for property in Special Flood Hazard Zones. Elsewhere, flood insurance is not required, and many people who are not required to have it don’t have it.
If owners do not have flood insurance, relief likely will come from federal disaster relief benefits, many of which must be repaid.
With that said, lots of people want to know what this new law is, so here’s a brief rundown. It is worth noting that the timing of the law’s effective date was not intentional. Most Texas laws go into effect on the September 1 immediately following their passage.
The claims process generally does not change. Under the law as it exists prior to September 1, 2017, there are certain requirements for policyholders giving notice of claims and certain requirements for how insurance companies respond to those claims. Insurance companies have a limited time to investigate and pay valid claims that are covered by the policy. If the insurance company does not comply with those requirements, they must pay, in addition to the amount of the claim, interest on the claim at 18 percent per year, plus reasonable attorney fees. Note that a notice of an insurance claim and pre-suit notice are two different things.
Policyholders may sue insurers for breaching an insurance contract, and they may also sue for certain unfair or deceptive practices, such as unfair claim settlement procedures and bad faith conduct. They also may retain a lawyer. This does not change.
Additionally under current law, the insurance company may be awarded its reasonable and necessary attorney fees if the policyholder brings a lawsuit that is groundless and brought in bad faith or for the purpose of harassment. This does not change.
Under the current law, a person who files a suit seeking damages from an insurance company for an unfair or deceptive practice must give 61 days pre-suit notice advising of the specific complaint, and the amount of actual damages and expenses, including attorney fees. The insurance company may make a settlement offer within 60 days, within 20 days after mediation, or within 90 days of the date when the insurance company files its written answer to the lawsuit. This does not change.
The next part is a little difficult to explain, but basically here’s what it says: If the insurance company’s offer was reasonable (in line with what is determined at trial) and the claimant refused it, the claimant cannot recover more damages, and attorney fees are capped at the amount incurred as of the date of the offer.
What has changed is the amount of interest that may be recovered. Instead of 18 percent per year, the interest on certain claims is now calculated at 5 percent more than the normal postjudgment interest rate. This rate fluctuates with interest rates, but the current postjudgment interest rate is 5 percent, so a claimant may still collect 10 percent interest. Attorney fees may still be collected if they are reasonable and necessary.
Additionally, once the insurance company receives the notice, they have 30 days to submit a written request to inspect, photograph, or evaluate the property. The inspection must be completed within 60 days of the pre-suit notice, if reasonably possible.
Under the new law, the claimant may recover attorney fees up to the lesser of: (a) the amount supported by the evidence at trial, (b) the amount that may be awarded under other applicable law, or (c) in the same fraction as the amount of damages alleged in the pre-suit notice bears to the amount awarded at trial. If the award at trial is at least 80 percent of the amount demanded in the pre-suit notice, the claimant may recover all of his attorney fees as supported by the evidence at trial. If the award at trial is less than 20 percent of the amount demanded in the pre-suit notice, the claimant may not recover attorney fees. This provision is designed to prevent excessive demands being made in the pre-suit notice.
These new provisions apply to lawsuits against insurance companies and insurance agents for the unfair or deceptive practices previously mentioned, as well as breach of contract, negligence, misrepresentation, fraud, or breach of another common law duty, but only on claims arising from damage to real property caused by forces of nature. It does not apply to actions against the Texas Windstorm Insurance Association, and it does not create flood coverage where none exists.
To collect under the old law, notice of claim must have been given to the insurance company by August 31, 2017. If notice of claim is given on or after September 1, 2017, the claim will be governed by the new law.
____________________
Adams (radams@mays.tamu.edu) is a member of the State Bar of Texas and a research attorney for the Real Estate Center at Texas A&M University.

 May new home sales gain 2.2% from April
Sales of new single-family houses in May 2015 were at a seasonally adjusted annual rate of 546,000, which is up 2.2% from April, according to estimates released jointly today by the U.S. Census Bureau and the Department of Housing and Urban Development. — From Housing Wire
3 ways to tame student loan debt and afford a mortgage
It’s no secret that student loans can make buying a home a challenge. But what exactly is the problem, and how can buyers overcome it? The problem is that student loans can be included in the buyer’s debt-to-income ratio, or DTI. — From Bankrate
Warren Buffett stars in animated series aimed at teaching kids to be billionaires
Forget Sesame Street. Welcome to Warren’s World. As in Warren Buffett, the investment guru who chairs Berkshire Hathaway BRK.A, -0.36% and sits atop a $70 billion fortune. Already known as one of the most famous investors in the world, the Oracle of Omaha has become celebrated of late among the grade-school set for his work with the Secret Millionaires Club, an animated program that teaches kids about finance. — From Market Watch
70 million Americans teetering on edge of financial ruin
In the past few years, the job market has vastly improved and home prices have rebounded — yet Americans are becoming even more irresponsible when it comes to saving for emergencies. According to a survey of 1,000 adults released by Bankrate.com on Tuesday, nearly one in three (29%) American adults (that’s roughly 70 million) have no emergency savings at all — the highest percentage since Bankrate began doing this survey five years ago. What’s more, only 22% of Americans have at least six months of emergency savings (that’s what advisers recommend) — the lowest level since Bankrate began doing the survey. — From Market Watch

Active Home-Building Industry Will Lead to More Demand for Warehouse Space
Strong consumer spending and the rise in housing construction activity are currently the prime factors for the incredible rebound of the U.S. industrial real estate sector, and experts say as home buying continues to increase, so will demand for warehouse space. — From NRE Online
To Buy or Not to Buy: That Is the Developer’s Question
Read more